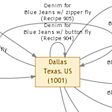
Mark McBride has written Automating Data Visualization with Ruby and Graphviz, a great introduction to using Ruby with the popular Graphviz tool to produce visualizations of data.
The article starts off with an example of the sort of data you might want to analyze then moves on to explaining GraphViz and its "DOT" notation. From there, Mark leaps straight into using the ruby-graphviz library and provides code to produce a graph for a sample data set.
Once you get in to Graphviz you might also want to check out RailRoad, a "Ruby on Rails diagrams generator" that produces model and controller relationship diagrams from your Rails applications.
Support from: Brightbox; - Europe's leading provider of Ruby on Rails hosting. Now with Phusion Passenger support, each Brightbox server comes with access to a managed MySQL cluster and redundant SAN storage. Brightbox also provides managed services for large scale applications and dedicated clusters. — Special Offer: 50% off all new Brightboxes! For a limited period, get a Brightbox from £19.50 a month...
Comments
Peter Szinek ·
Great find Peter, thanks a million!
Martin ·
I found Graphviz extremely helpful when I needed to understand exactly what was going on in an extremely complex module. I wrote a quick bit of code to parse a module's object space and push out a DOT file (http://github.com/waslogic/mod_dotter/tree/master). Using dot to process the file into SVG allowed me to see everything in one place that had been spread out over several dozen files.