 Just over 3 years ago in May 2008, I wrote about New Relic for the first time. Since then they've grown rapidly and dominate the Ruby and Rails application monitoring scene with their RPM service. Today, they've made some major tweaks..
Yo Ho Ho and a Bottle of RUM (Real User Monitoring)
New Relic's CEO Lew Cirne (whose name is an anagram of New Relic - geddit?) invited me onto a call to tell me about a new feature that they call "Real User Monitoring" (a.k.a. RUM). Essentially it's a significant expansion to the things that the New Relic system tracks.
With RPM, you might already be tracking your web app's database queries, slow query times, your slowest controller actions, how long it takes to build pages, and things like that. Real User Monitoring adds real user tracking to that, in the sense that some extra JavaScript magic is deployed by the New Relic agent which sends back stats on page rendering, DOM speed, browser info and the like. If a user is experiencing a performance issue, you'll know about it.

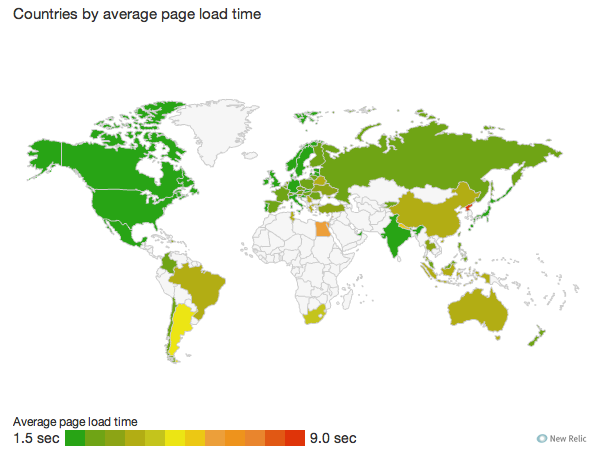
At first I wasn't majorly impressed but as Lew showed me around the system, the impact of this addition (which comes free for all New Relic users - no extra costs, I'm told) became apparent. For example, there was a world map (like above) which showed the average page load times for the New Relic app across the world. Norway was in bright red and I asked why. Lew was only too ready to dig into the issue.
We clicked on Norway and saw a graph of the database, rendering, network, DOM processing, and other factors over time. It turned out that nothing was wrong with New Relic's app but the "network" time had soared in the past few hours. Lew remembered that one of their CDN partners was having problems in Scandinavia that day which explained the issue. That's the sort of feedback that's worth its weight in gold.

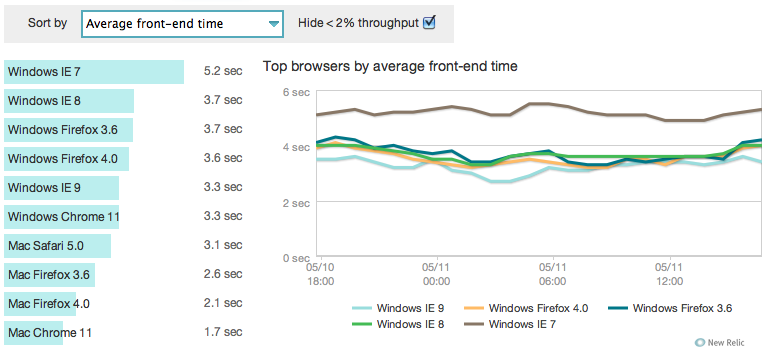
Lew also showed off a section that showed page rendering times by browser. Unsurprisingly, Internet Explorer on Windows was showing the highest times with Chrome coming in as the speed king. While this wasn't much of a shock, it was interesting to see how you could drill down and use it to diagnose inefficiencies in your own code. For example, let's say your JavaScript was using a technique that worked fast on Chrome and Safari but was incredibly slow on Firefox. The new RUM feature on New Relic would highlight this sort of issue to you.
I'm not going to keep going on about RUM or all the cool stuff that's in it because if you're not using New Relic or not interested in signing up for it, nothing more than the above is going to convince you. But if you are a New Relic user or considering it, head over there and check it all out.
No more RPM
If you've kept an eye on New Relic or are already a user, you'll know that their main service is called "RPM". Well, no longer. It's hardly the falling of the Berlin Wall on the news stakes, but they've ditched the RPM moniker and the service is now simply known as "New Relic." Don't worry - they haven't killed the service! Just the name :-)
Package Tweaks
New Relic have made plenty of changes across their site and to their service (including a cleaner, new UI) but they've also worked on the packages they offer. Previously their "Bronze" service was $50 per month per server but this has changed to the "Standard" package which is.. $24 per month per server (with a year's commitment). Half the price and with Real User Monitoring added in for free.
The other packages are the "Pro" package at $149 per month and the "Business" package for companies with 5 or more servers which is $119 per month per server. The offering is definitely clearer than it used to be and the price drop at the low end is probably going to encourage a lot more companies onto the service.
Disclaimer: New Relic is a sponsor of Ruby Inside but this is not a paid post.

Comments
(unknown) ·
Pingback: Thanking Ruby Inside’s April and May 2011 Sponsors (Training, Haml Conversion and More)