Charlie Savage, author of ruby-prof, recently baked in support for Rails to ruby-prof, so now it's possible to profile your Rails application, see where the delays are, and work on improving performance.
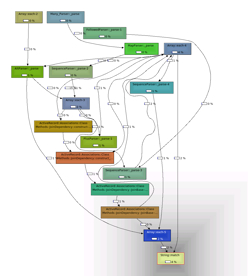
Hot on the heels of this development, Charlie wrote "How to Profile Your Application", an article that does just what it says on the tin, and which demonstrates how to profile the CPU time used on a single Rails request, and visualize the call tree.
This was quickly followed up with "Making Rails Go Vroom", another great article that looks at what parts of Rails significantly slow things down. Charlie comes up with six key suggestions:
- Don't use ActiveRecord#attributes or ActiveRecord#read_attribute
- Get your :includes right
- Don't check template timestamps ( cache_template_loading = true)
- Don't use url_for
- Don't let Rails parse timestamps
- Don't symbolize keys (local_assigns_support_string_keys = false)
Learn more and see how Charlie came to his conclusions in the article.
Comments
(unknown) ·
Pingback: blogwi.se